If you are in an online business, I bet you heard a term “A/B testing”. If you are in marketing or in e-commerce, you may even run A/B testing regularly.
It is a form of randomized control trial. Suppose you are promoting a rewards program for your online shop. Somewhere between the user browsing the catalog and closing the sale, you slip in a copy and the button to sign up for the rewards program. One version of the button says, “sign up” as it has been and other says the new message “start saving with one click”. All the visitors to your website are assigned to one of two groups at random by the web server and they see one of two copies on the button accordingly. By doing so, you are testing the hypothesis that the explicit message of the benefits instead of a simple “sign up” would yield more sign-ups.
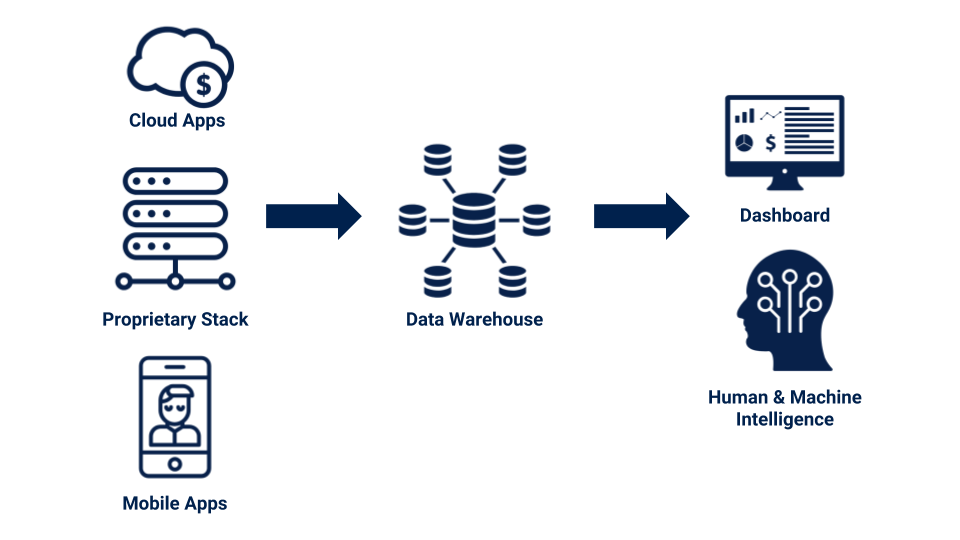
There are online services that accommodate such experiment automatically on websites or on mobile apps. Those services are rapidly driving the conversion rates of online businesses higher and higher.
But what happens if your service is deployed in brick and mortar retail stores?
Consider this case. Let’s just pretend that we are growth hackers at Foursquare (now Swarm) and we want our users not to forget to check-in with our app when they shop locally. We had a simple but great idea of handing out Foursquare stickers. The merchants can stick them on the front door to remind their customers to check-in. How can we know if the sticker is effective? And by how much?
If we are the actors in a science fiction novel, we can operate in two alternate universes: Mrs. Defarge is visiting a local coffee shop. In Universe A, she sees the sticker before entering the shop. In Universe B, she does not. The rest, including the exact time she enters the store, what she is wearing, which of the staff welcomes her, who else is in the store, the temperature of the moment, her mood, etc, and etc are all the same so that we can measure the isolated effect of the sticker.
The outcomes are:
- UniverseA: - Mrs. Defarge sees the sticker and checks in. - Mrs. Defarge sees the sticker but does not check in.
- Universe B: - Mrs. Defarge does not see the sticker but checks in anyways. - Mrs. Defarge does not see the sticker and does not check in.
You can observe many more visitors to measure the proportion of the people who checked in in each universe, thereby calculating the effectiveness of the sticker. You can do the same experiment in many more stores, not just coffee shops, but also restaurants, hair salon, grocery and so forth to generalize the conclusion.
But you will never be able to live in two alternate universes.
So, what you will do is to randomly assign many stores into Control and Treatment groups and put the stickers on the front doors of the stores in Treatment group. By assigning randomly, you are giving the stores with different attributes (what they sell, how busy they are, store hours and so on) similarly distributed in the two groups. The only difference between the two groups is the presence of the sticker.
In this way, you can pretend that you are living in two alternate universes at least in a statistical sense.
But here is another problem. You know when your user uses your app to check-in. But you will never know who visited the store without checking in unless you hire people to hang out at each store all day and night to count precisely how many people visited the store. You are half blind!
What can you do?
Only data you will have is the total number of people who check-in at each store and which group they belong to.
You could calculate the average check-in count from each group during a set period and compare the difference. But you can easily imagine there would be a small difference caused by a random cause even when there is zero effect by the sticker. So, suppose that there is indeed an effect by the sticker, how much difference would we need to observe in order to conclude the difference of the means is caused by the sticker, but not by a random fluctuation.
Suppose the number of monthly check-ins is normally distributed with an average of 130. 60% of the businesses from the top performer has 140 check-ins. And only top 5% has 195 or more check-ins. If the difference between the average check-ins between Control and Treatment are 30, you are not probably convinced that the sticker is making a difference:
But the difference is 200, you will spend money printing the sticker and handing over to the merchant for free:
The question is how we can draw a line to conclude that the sticker is indeed making a difference and the difference is worth your investment. You want to learn the answer economically, so you take samples and print much fewer stickers than the number of all the retail stores in the area.
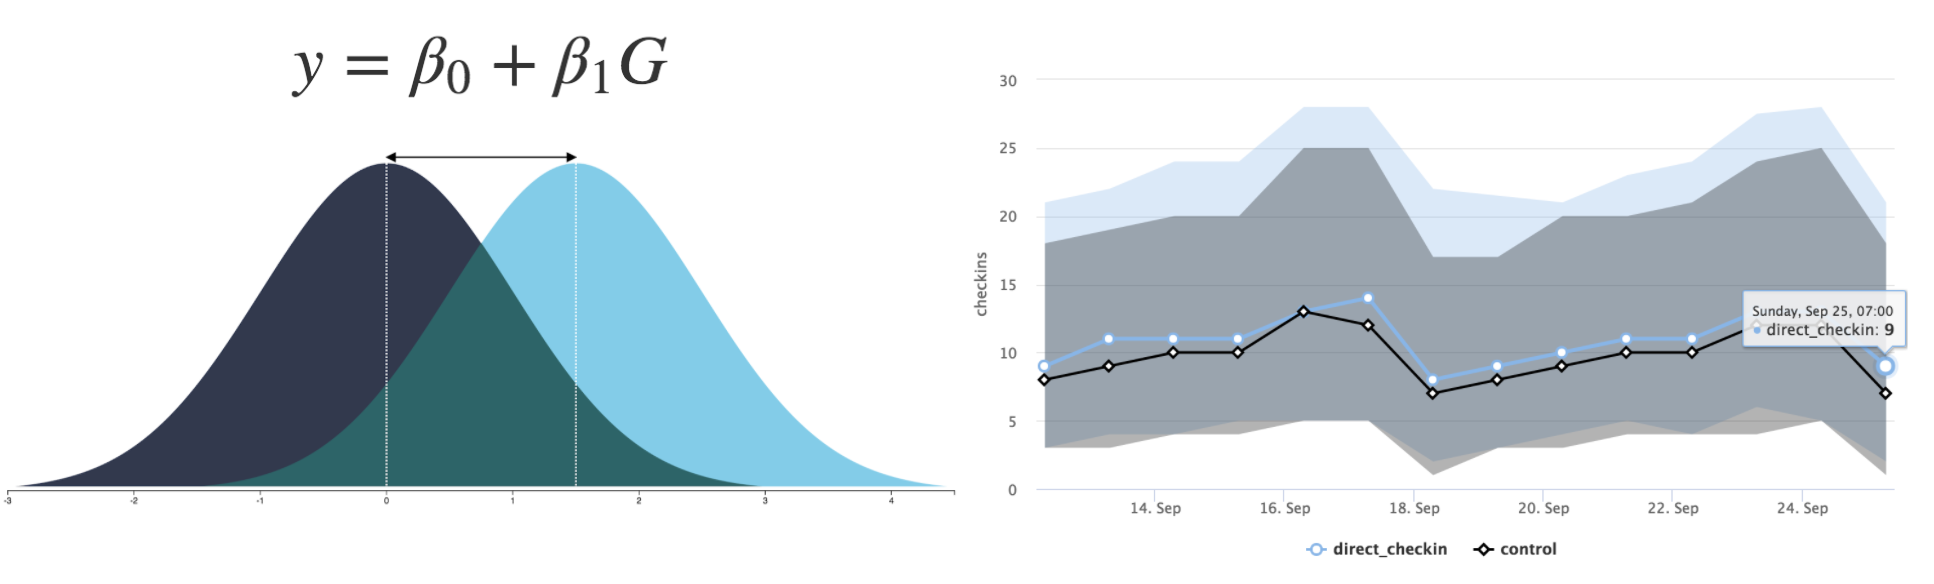
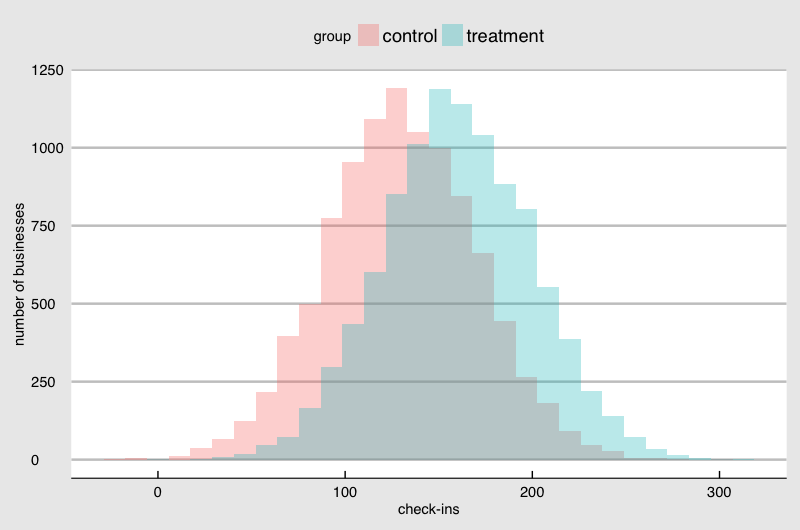
In general, the more samples you can afford, the smaller effect by the sticker you can detect (if any). Another factor that affects this detectability is how the check-ins are distributed among the stores. The above example with normality assumption is not realistic. If I plot the check-ins from a data set published by Foursquare it looks like this:
You see a skew in the distribution. It makes sense if you imagine that stores like coffee shops have higher foot traffic than hair salon and one type of store is not seen as often as another. Some store owners are invested in the social media more than another. They all cause the difference in the check-in and they are not random. This kind of non-normality in the real data makes the estimation of the detectability given a sample size much more challenging.
In business, it is a data scientist’s responsibility to estimate the effect you could detect given an experiment design. And good data scientists work closely with business experts to plan the most economical way of testing the business idea using their expertise in building sophisticated models.
If you have product feature or marketing idea and you want to measure the impact but don’t know where to start, please contact hello@anelen.co (.co, not .com don’t get your email lost elsewhere!) or schedule a free discovery meeting with the scheduler.